This article provides a brief overview of ways to import data into some of the more popular analysis tools.
This step is common regardless of the program you choose.
- The first step is to identify the dataset you want to import. Visit datasf.org/opendata to search the City of San Francisco’s Open Data Portal to locate the dataset of interest. For the purposes of this guide we will be using the Fire Safety Complaint database. Searching for Fire Safety Complaints brings up
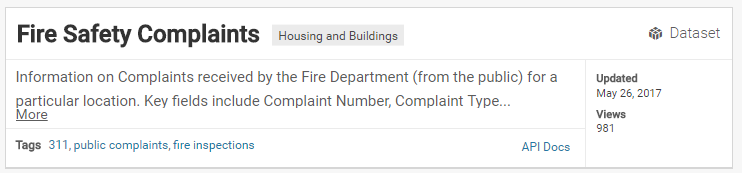
- Select Fire Safety Complaints to be taken to the dataset landing page. On this page you can get a quick overview of the dataset. Be sure to scroll down to get a useful high level overview of the dataset including: publishing details, row count, data dictionary (if available), column names/types, and table preview.
Import into Analysis Program
We will cover 4 popular programs:
PowerBI
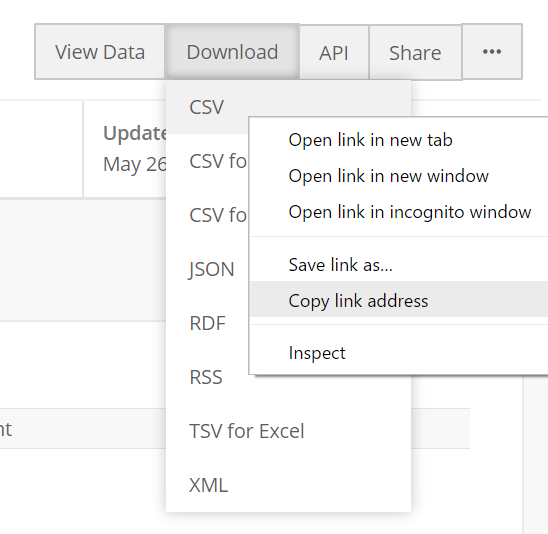
- For PowerBI, the best endpoint is the weblink to the csv. To grab it from the Data Set landing page select download in the upper right corner of the screen. Hover over CSV and right click. Select Copy Link Address. It may also be called Copy Link (IE) or Copy Link Location (Firefox).
- You should now have a web-based ‘endpoint’ for the data set. This provides a consistent location that PowerBI can refer to get the most up to date info. In this example that location is https://data.sfgov.org/api/views/2wsq-7wmv/rows.csv?accessType=DOWNLOAD
- Let’s pause and consider the benefits of using the web end point instead of downloading the csv file to your computer. While that can easily be imported into Tableau/PowerBI/Excel the resulting analysis will be tied to historical data, unless you manually re-download the data to your computer. With an web endpoint each time PowerBI runs it will take in the most up to date data saving you a step!
- Now that we have the endpoint we are prepared to import into your preferred analysis/visualization program
- Launch PowerBI
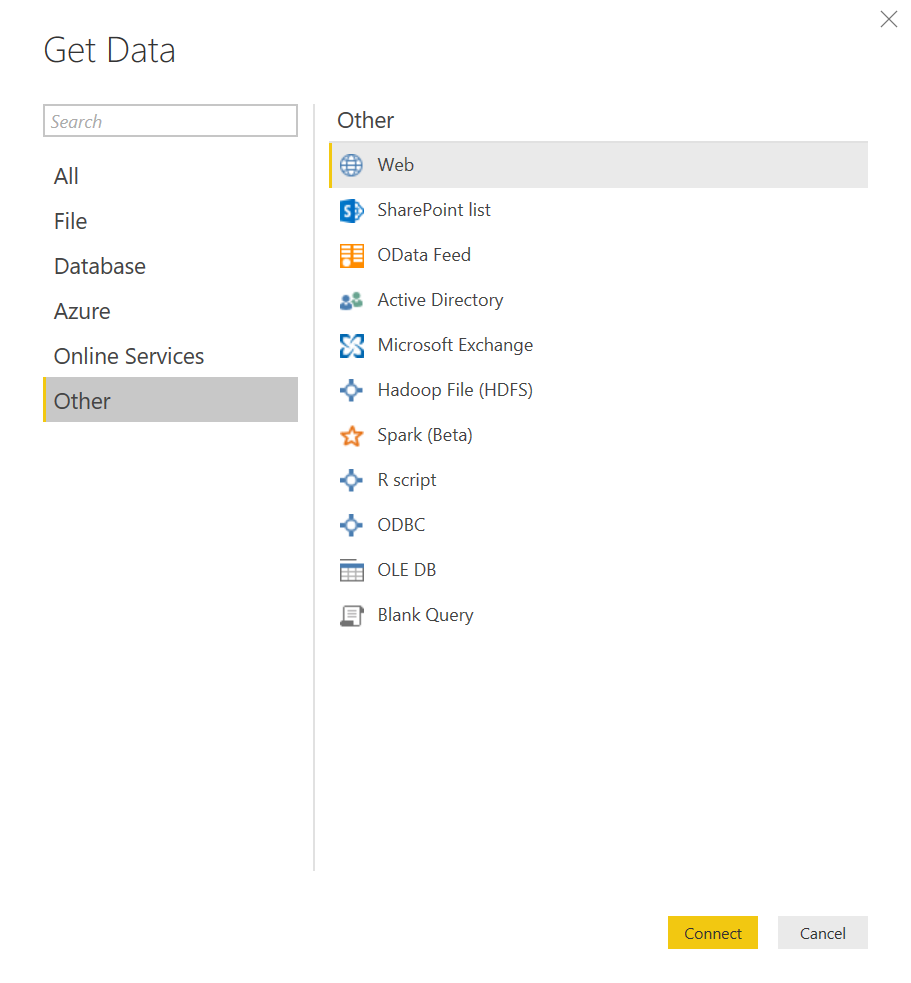
- Select Get Data from the upper left corner.
- Select ‘Other’ from the left hand column and ‘Web’ from the options that appear. Click Connect
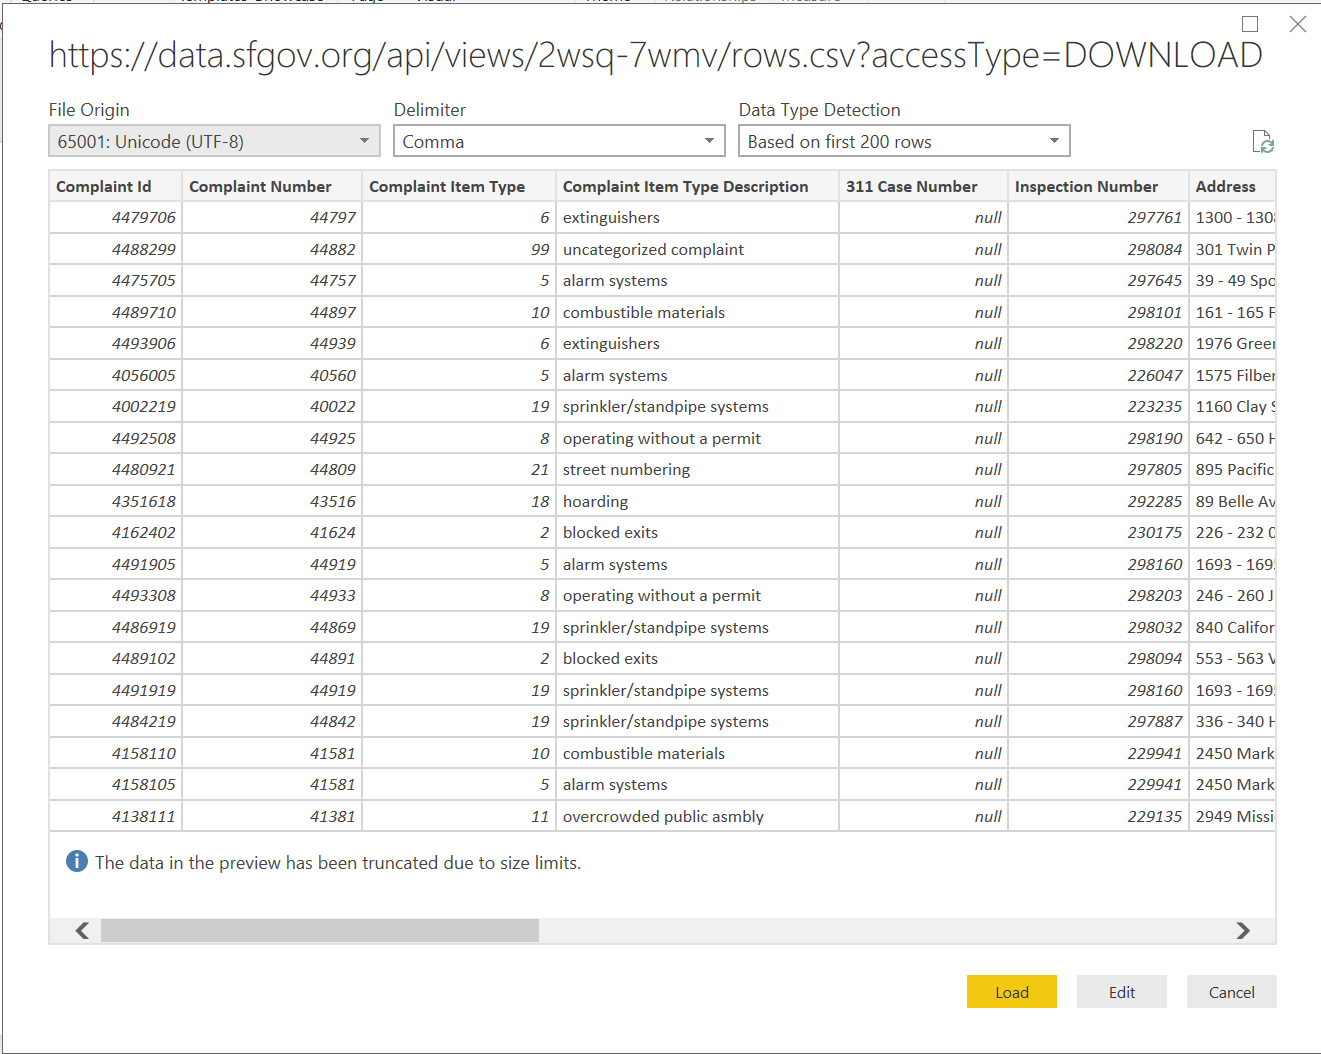
- Paste in the URL you copied from the Open Data portal. For this guide that was for Fire Safety Complaints
- If successful you will be presented with a preview window. From which you can go into the Query Editor (edit) or begin constructing visuals (load). Once published your dashboard/report/visual will update nightly with the latest data from the open data portal


For further training/guides in using PowerBI DataSF recommends
-
Data Academy course on PowerBI (City and County employees of San Francisco only)
-
The following web trainings
-
Beginner - EdX Course - Analyzing and Visualizing Date with PowerBI (focus on modules 0 - 6)
-
Tableau
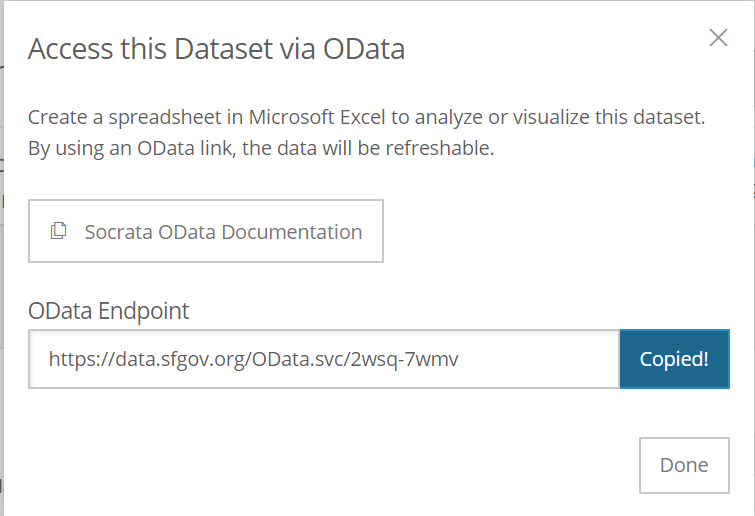
For Teableau, the best endpoint to use is OData. To grab it from the Data Set landing page select the ellipses (...) and select Access Data via OData.

- Select Copy
- Open Tableau
- Select OData
- In the OData window paste in the URL you copied from the Open Data portal. For this guide that was for Fire Safety Complaints. Select No Authentication and click Sign In.
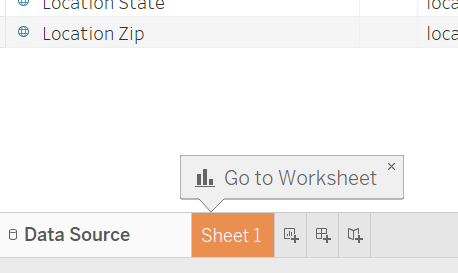
- Verify it imported in the data
- If all looks correct, select Sheet 1 to begin working in Tableau


For further training/guides in using Tableau DataSF recommends
- Data Academy courses on Tableau (City and County employees of San Francisco only)
- The following web trainings
- Beginner - Lynda.com (free with SF library card) - Tableau 9 Essential Training
- Beginner - Lynda.com (free with SF library card) - Creating Interactive Dashboards in Tableau
- Tableau’s Training Videos
ArcMap Online
ArcMap is a unique case as it can take in both datasets and geographic boundary files. As before we are going to use Fire Safety Complaints dataset. In addition we will import a geographic boundary file of the Bureau of Fire Prevention Districts.
Importing a Dataset
- For ArcMap Online, the best endpoint is the weblink to the csv. To grab it from the Data Set landing page select download in the upper right corner of the screen. Hover over CSV and right click. Select Copy Link Address. It may also be called Copy Link (IE) or Copy Link Location (Firefox).
- You should now have a web-based ‘endpoint’ for the data set. In this example that location is https://data.sfgov.org/api/views/2wsq-7wmv/rows.csv?accessType=DOWNLOAD
- Navigate to ArcMap Online Map Creator: https://www.arcgis.com/home/webmap/viewer.html
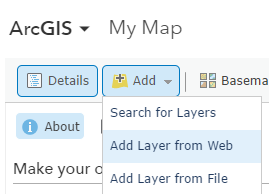
- Select Add -> Add Layer from Web
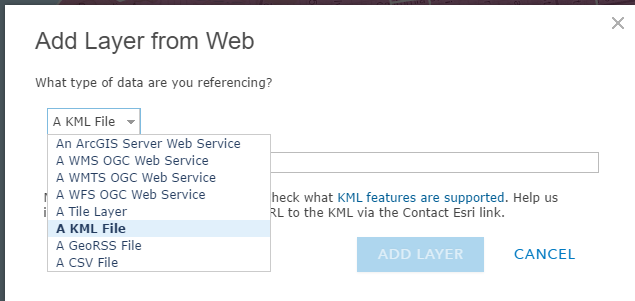
- Select CSV from the drop down menu
- Paste in the web-based CSV endpoint you copied in the previous steps. Click Add Layer
- ArcMap will automatically try to identify relevant geographic fields such as street, zipcode, etc. If it fails to identify some you can manually select. Click Add Layer
- Note in the free version only 250 points can be imported. City and County of San Francisco employees have access to a paid version through a city-wide EA agreement with ESRI.
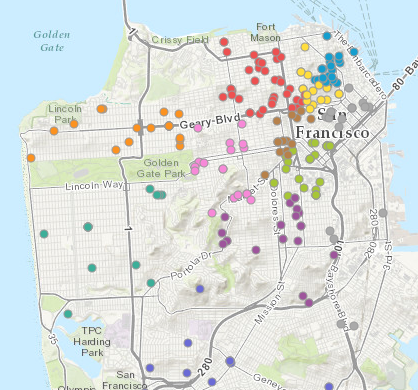
- If successful you should see a map with points (assuming the data you imported had address information)


Importing a geographic boundary file
- The Open Data portal also has geographic shapefiles unique to San Francisco. For this guide we will be using the Bureau of Fire Prevention Districts. Navigate to that page.
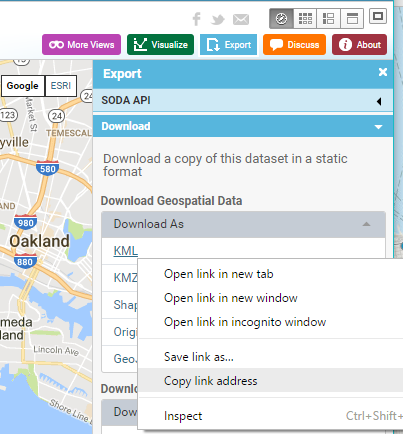
- Select Export in the top right corner and right click on KML. Select copy link. You should now have this address https://data.sfgov.org/api/geospatial/rfte-nv64?method=export&format=KML
- Navigate to ArcMap Online Map Creator: https://www.arcgis.com/home/webmap/viewer.html
- Select Add -> Add Layer from Web
- Select KML from the drop down menu
- Paste in the web-based KML endpoint you copied in the previous steps. Click Add Layer.
For further training/guides in using ArcMap online DataSF recommends
- The following web trainings
CARTO
CARTO is a unique case as it can take in both datasets and geographic boundary files. As before we are going to use Fire Safety Complaints dataset. In addition we will import a geographic boundary file of the Bureau of Fire Prevention Districts.
Importing a Dataset
- For Carto Online, the best endpoint is the weblink to the csv. To grab it from the Data Set landing page select download in the upper right corner of the screen. Hover over CSV and right click. Select Copy Link Address. It may also be called Copy Link (IE) or Copy Link Location (Firefox).
- You should now have a web-based ‘endpoint’ for the data set. This provides a consistent location that Carto can refer to get the most up to date info. In this example that location is https://data.sfgov.org/api/views/2wsq-7wmv/rows.csv?accessType=DOWNLOAD
- Navigate to Carto: www.carto.com and sign in
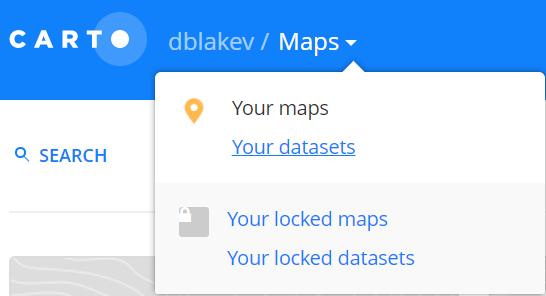
- Select your datasets from the drop down menu
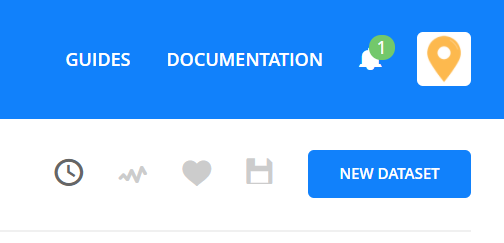
- Select New Dataset from the top right corner
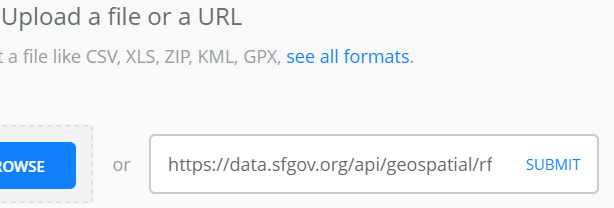
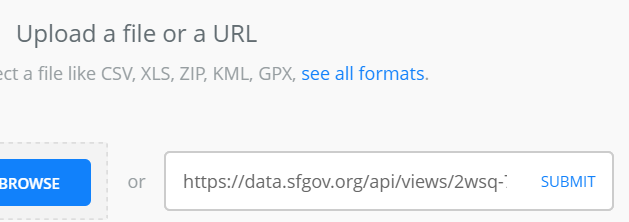
- Paste in the CSV web end point and click submit
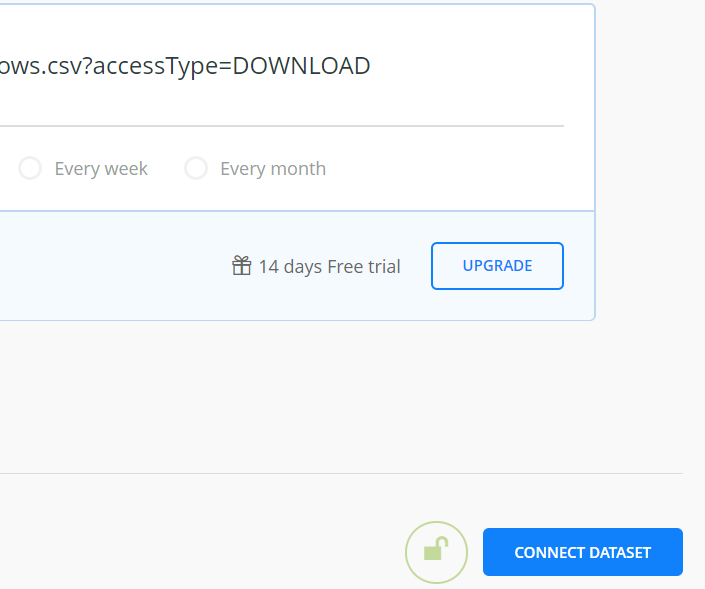
- Select Connect Dataset. Note: Free accounts are not able to autorefresh the data
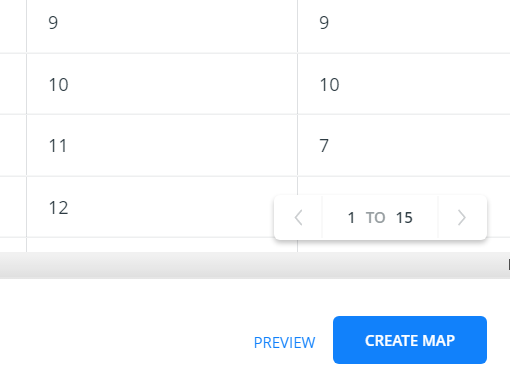
- Inspect the Data and when Ready click Create Map to begin building!

Importing a geographic boundary file
- The Open Data portal also has geographic shapefiles unique to San Francisco. For this guide we will be using the Bureau of Fire Prevention Districts. Navigate to that page.
- Select Export in the top right corner and right click on KML. Select copy link. You should now have this address https://data.sfgov.org/api/geospatial/rfte-nv64?method=export&format=KML
- Navigate to Carto: www.carto.com and sign in
- Select your datasets from the drop down menu
- Select New Dataset from the top right corner
- Paste in the KML web end point and click submit
- Select Connect Dataset. Note: Free accounts are not about to autorefresh the data
- Inspect the Data and when Ready click Create Map to begin building!